I wrote a quick Perl script to visualize SNPs in a gene from experimental evolution sequencing data. Useful for making figures when one gene is hit by mutations in multiple lineages. It outputs an SVG file with the reference sequence and the changes.
For the moment, it only visualizes substitutions, not insertions/deletions or anything more exotic. More to come.
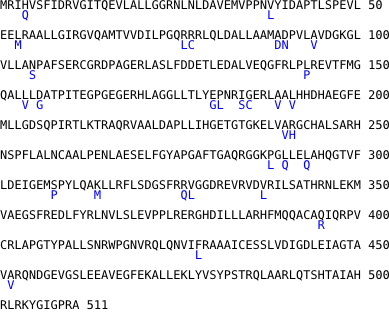
Example: SNPs found in Pseudomonas aeruginosa gene PA2449 (converted to PNG)
(Thanks to Sofia Robb for teaching Perl as part of Programming for Evolutionary Biology!)
Download SNPsvg here.
