Category Archives: Tools

Things I made that others might want to use (scripts, etc.)

R and ggplot2: Make zero print as “0”

The aesthetics of R printing zeros with superfluous decimal places (e.g. “0.00” instead of “0”) has always bothered me. I also want to keep the number of decimal places for the other ticks consistent (e.g. “0, 0.5, 1.0,” not “0, 0.5, 1”). I could get prettyNum() to fix the “0” instead of “0.0”, but then it was also giving me “1” instead of “1.0”.

It’s possible to get the desired output, for an arbitrary number of decimal places, without resorting to manually defining the break labels. We first define a function to format the labels how we want, using formatC(). We then supply it to the “labels” argument of scale_*_continuous, which takes the original numeric values calculated for the breaks, and applies the function to them.

# Make zeros print as "0" always
prettyZero <- function(l){
	max.decimals = max(nchar(str_extract(l, "\\.[0-9]+")), na.rm = T)-1
	lnew = formatC(l, replace.zero = T, zero.print = "0",
		digits = max.decimals, format = "f", preserve.width=T)
	return(lnew)
}

# Try it out: compare x-axis and y-axis
somedata = tibble(x = runif(n = 100)-0.5, y = runif(n = 100)-0.5)
ggplot(data = somedata, aes(x, y)) +
	geom_point() +
	scale_y_continuous(labels = prettyZero)

A tidyverse approach to manipulating BMG Labtech OMGEA and stacker output

Here is some R code for dealing with ASCII files as output by BMG MARS analysis

csm_microplate-stacker_317840ffa5.png

software, specifically to make use of data spread across different plates as a result of using the BMG Microplate Stacker.

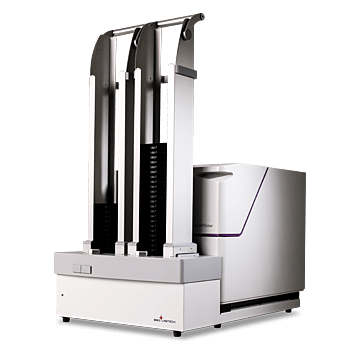
I had a few problems with the stacker jamming when we first got it, but this was solved by (1) lubricating the magazines with a silicon spray (food-grade, not sure if that matters), (2) periodic cleaning with a degreaser, and (3) making the first step of any protocol a ‘restack’ all plates command, so that the plates are positioned more accurately. Since doing these steps, I’ve had minimal problems. In general, I like BMG plate readers for the exact reason most people don’t: the scripting language. Although it isn’t the most sophisticated, the scripting language is powerful enough to design some fairly complex protocols. Combined with the stacker, which can hold either 25 or 50 microplates depending on which magazine set you have, it’s useful for running high-throughput phenotype assays.

require(lubridate)
require(tidyverse)
require(growthcurver)

# Some functions for importing BMG-style CSV files in a tidy way
BMGtime = function(otime){
# A function to convert BMG's default time format to fractional hours (can also set in MARS)
missing.s=grep("[0-9] s",otime, value=F,invert=T)
missing.m=grep("[0-9] min",otime, value=F,invert=T)
missing.h=grep("[0-9] h",otime, value=F,invert=T)
otime[missing.s]=sub("$"," 0 s", otime[missing.s])
otime[missing.h]=sub("^","0 h ", otime[missing.h])
otime[missing.m]=sub("h", "h 0 min ", otime[missing.m])
otime=period_to_seconds(hms(gsub("[a-z ]+",":", otime)))/3600
return(otime)
}

# BMG MARS CSV exports have a trailing comma, so this drops the empty last column
read_csv_drop = function(...) read_csv(...) %>% select(-ncol(.))

# Read a single BMG Mars wide-format time series table into long format
readBMG = function(file){
growthdata = read_csv_drop(file, skip=0) %>%
select(-contains("Blank corrected"))
ndescriptors = ifelse("Group"%in%names(growthdata), 4, 3)
header = tolower(gsub("Well ", "", names(growthdata)[1:ndescriptors]))
time = growthdata %>% select(-(1:ndescriptors)) %>% slice(1) %>% t()
if(grepl("[a-z]", time)) time = BMGtime(time)
names(growthdata) = c(header, time)
growthdata = growthdata %>%
slice(2:n()) %>%
type_convert() %>%
gather("time","value",-header)
return(growthdata)
}
# Read multiple files from the same experiment (resulting from a stacker run)
readStack = function(path=NULL, pattern, parse.name=F, prefix=NULL, suffix=NULL, into=NULL, sep=NULL, ...){
stackdata = data_frame(id = list.files(pattern=pattern, path=path, ...), data = map2(id, path, ~readBMG(paste0(.y,"/",.x))))
if(parse.name){
if(!is.null(prefix)){
stackdata = stackdata %>%
mutate(id = gsub(prefix, "", id))
}
if(!is.null(suffix)){
stackdata = stackdata %>%
mutate(id = gsub(suffix, "", id))
}
stackdata = stackdata %>% separate(id, sep=sep, into=into)
}
stackdata = stackdata %>% unnest(data) %>% type_convert()
return(stackdata)}

SNPsvg

I wrote a quick Perl script to visualize SNPs in a gene from experimental evolution sequencing data.  Useful for making figures when one gene is hit by mutations in multiple lineages.  It outputs an SVG file with the reference sequence and the changes.

For the moment, it only visualizes substitutions, not insertions/deletions or anything more exotic.  More to come.

Example: SNPs found in Pseudomonas aeruginosa gene PA2449 (converted to PNG)

figure

(Thanks to Sofia Robb for teaching Perl as part of Programming for Evolutionary Biology!)

Download SNPsvg here.


Regex to change bracket citations into bibtex keys

Useful for converting in-text citations (from e.g. Word) into a LaTeX document.  Converts bracket notation into first 3 chars of first author’s last name (or 2 chars, if only 2 chars long), plus two-digit year: e.g. (Bobby 2009) becomes \citep{Bob09}.  See also my post on how to insert bibtex references into Word.

Search for:

\(([A-Za-z]{2,3})[A-Za-z -.]* (18|19|20)([0-9a-z]{2,3})\)

Replace with:

\\citep{\1\3}

Test citations:

(Bobby 2009)
(Bobby and Jonny 1909)
(Bobby et al. 1923)

(Maynard Smith 1989)
(Maynard Smith and Haigh 1974)
(Maynard Smith and Bobby-Jonny 1974)
(Maynard Smith and Maynard Smith 1974)
(Maynard Smith et al. 1993)

(Maisnier-Patin 1900)
(Maisnier-Patin and Bobby-Jonny 1956)
(Maisnier-Patin et al. 2002)

(Aa 1932)
(Aaa 1932)

Fluctuation test calculator: FALCOR copy/paste issue

Update 2019-07-31 FALCOR is offline. I did try contacting the author through Twitter, but have received no response. Since people still seem to look at this post regularly, consider switching to the R package flan for fluctuation tests. There’s even a way to launch a FALCOR-style web app through Shiny (interactive websites powered by R), ShinyFlan. We will be using this package in future.

FALCOR (Fluctuation AnaLysis CalculatOR) is a handy Java applet designed to estimate mutation rates from fluctuation test data. A Java update prevents access to the clipboard to unsigned Java applets. If you are having trouble copy/pasting your data into FALCOR, try modifying your java.policy file to include the line: permission java.awt.AWTPermission “accessClipboard” under where it says //”standard” properties that can be read by anyone.

// "standard" properties that can be read by anyone
permission java.awt.AWTPermission "accessClipboard"

Save the file, exit and restart Java (or any programs using it, like Firefox or LibreOffice), and copy/paste should work again. You may wish to consider removing the clipboard access after using FALCOR for security reasons.

Abbreviate journal titles with Jabref

I use KBibTeX to manage my references database, but I used to use Jabref.  Jabref has a handy feature that can automatically abbreviate journal names to their standard (ISO) abbreviation format.  The built-in list of abbreviations is missing a lot of common biology journals, but I have updated it with many biology journals.  You can get the most recent version of my abbreviations list from my Dropbox.

Integrating .docx and BibTeX

I have nearly every paper I’ve ever read stored in a BibTeX database, so I wrote a BASH script to build a list of citations using BibTeX that could be easily copied into LibreOffice Writer.  I would prefer to write all my papers in LaTeX, but there are some disadvantages–poor adoption and inefficient track-changes methods–so I have to use LibreOffice Writer instead.  None of the available bibliography managers that integrate with LibreOffice seem particularly reliable to me, and I plan to convert my manuscripts back to LaTeX anyway when I put my thesis together.

Continue reading